Tags
Pakistan sees double-digit rise in textile, rice exports in Jan
During July-Jan of this fiscal, rice total exports increased by 95.3% to $2.12bn compared to $1.08bn last year

In this photo, workers operate a machine at a textile factory. — AFP/File
ISLAMABAD: Pakistan’s textile and rice exports rose sharply in January, boosted by strong demand from international markets and favorable prices, official data showed on Friday.
The textile exports demonstrated a positive upswing in January 2024, registering a 10.1 percent increase to $1.455 billion compared to $1.32 billion in the corresponding month of the previous year.
During the month, its exports were 3.98 percent more than $1.4 billion in the previous month of December 2023, the Pakistan Bureau of Statistics (PBS) revealed on Friday. However, during July-January 2023-24, textile exports declined by three percent to $9.74 billion compared to $10.04 billion in the same period of last fiscal.
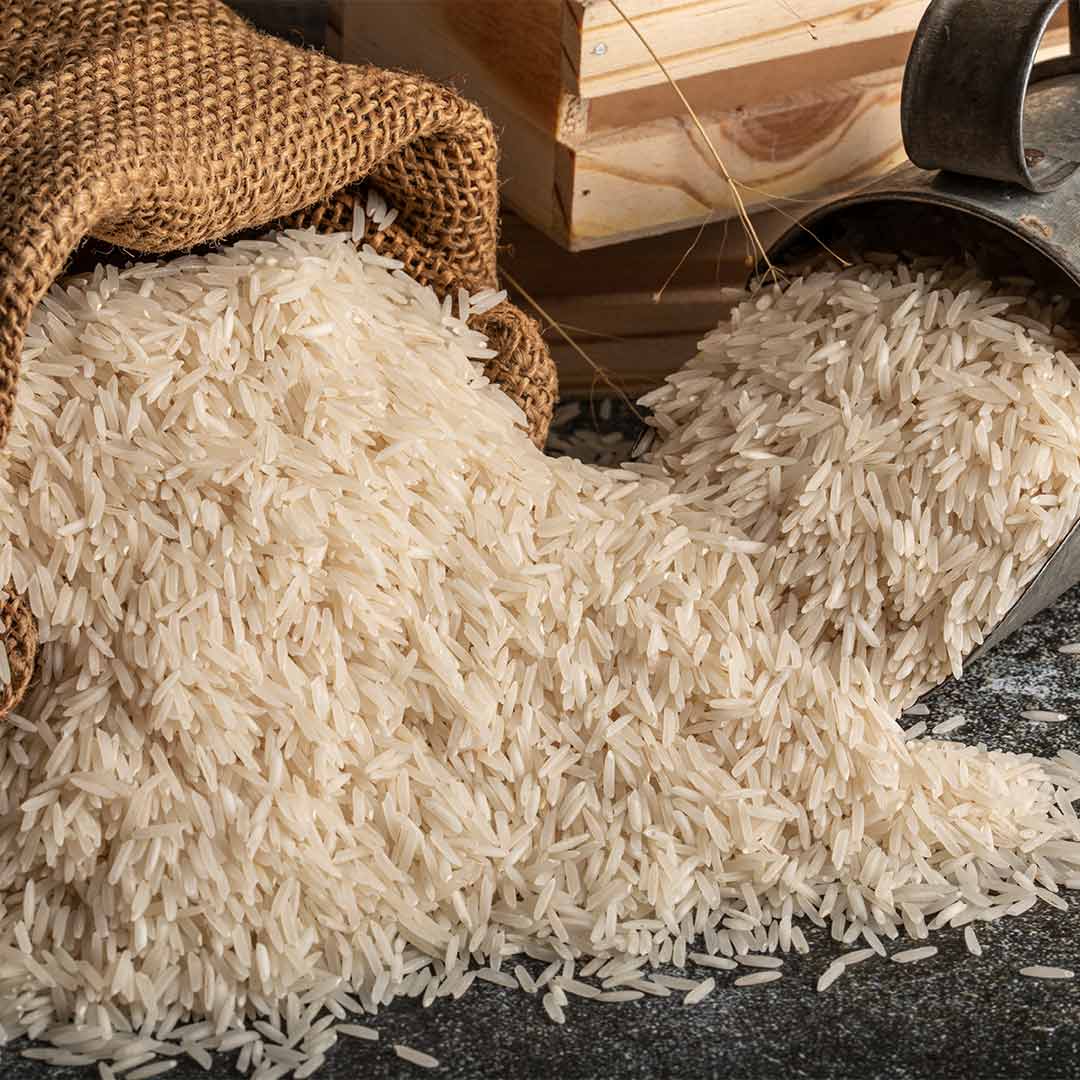
Rice exports also increased by 207 percent to $477.5 million, due to increased international market and high prices resulting from the rice export ban by India for the last several months. In the same month of last year, the grain export was $155.5 million.
Basmati rice exports during the month increased by 64 percent to $89.4 million, and other varieties’ exports increased by 284 percent to $388.1 million. During July-January of this fiscal, rice total exports increased by 95.3 percent to $2.12 billion compared to $1.08 billion last year. Of this, basmati total exports increased 35.6 percent to $457 million and other rice sales increased 122.2 percent to $1.66 billion.
Notably, in January 2024, sales of most major components of the textile group increased. This includes bedwear, knitwear, towels, and readymade garments, cotton cloth, and yarn.
During the month, exports of knitwear increased by 8.4 percent to $365 million, bedwear by 19.3 percent to $252 million, readymade garments by 13.85 percent to $333.4 million, and towels by 5.4 percent to $96.1 million. Likewise, cotton yarn exports increased 19.8 percent to $81.3 million and cotton cloth by 0.5 percent to $159.7 million compared to January 2023 exports.
In the food group, during January 2024, vegetable exports increased by 142 percent to $73 million, and fruits by 10.4 percent to $39.7 million. Similarly, meat and meat preparations sales abroad increased by 37.3 percent to $48 million, and tobacco exports increased by 11.5 percent to $11.5 million over the same month of last year. However, fish and fish preparation exports were down 17.8 percent to $30.2 million.
Football exports in January increased by 5.6 percent to $19.4 million, plastic materials increased by 103 percent to $36.3 million, engineering goods by 14.95 percent to $25.2 million, and footwear exports increased by 6.14 percent to $17.6 million.
However, pharmaceutical exports were down by 31.4 percent to $98.1 million, cement exports also fell 1.98 percent to $14.7 million, and surgical goods exports went down 5.7 percent to $37.7 million over January 2023. Likewise, leather manufacturing exports were down by 3.3 percent to $46.2 million.
Imports
In January 2024, the petroleum group’s total imports were $1.326 billion, and there was no change, as, in the same month of last year, the economy imported the same amount of petroleum.
However, petroleum products imports fell 37.8 percent to $427.5 million. On the other hand, crude imports increased by 13 percent to $366.5 million, LNG by 83.35 percent to $445 million and LPG imports increased by 22.3 percent to $87.3 million compared to January 2023’s imports.
During July-January of FY24, petroleum group total imports declined by 12.1 percent to $9.33 billion compared to $10.6 billion in the same period of FY23. Of this, the import of petroleum products was reduced by 25.9 percent to $3.62 billion, crude oil by 3.96 percent to $2.98 billion, but LNG imports increased by 4.8 percent to $2.3 billion, and LPG imports also decreased by 1.47 percent to $435 million.
Machinery imports in January 2024 increased by 50.2 percent to $750.4 million. Of this group, agriculture machinery imports increased by 394 percent to $12 million, and electrical machinery and apparatus imports also increased by 89 percent to $280.5 million. Likewise, telecom machinery and other apparatuses also saw a 197 percent increase to $232.7 million, with a major chunk of mobile sets imports.
In the telecom sector, Pakistanis imported mobile sets worth $195 million in January 2024 which was 275 percent more than last year’s January imports of $52 million.
However, construction and mining machinery importsfell by 5.6 percent to $8.87 million, textile machinery by 34.8 percent to $11.1 million, and power generation machinery imports decreased by 19 percent to $35.4 million.
The transport sector’s total imports in January 2024 fell by 3.9 percent to $135.5 million compared to $141 million in January 2023. Of the transport sector’s total imports, spending on road motor vehicles (built units, CKD/SKD) stood at 118 million which was 7.45 percent more than $110 million in the same month of last year.
However, on completely built units (CBU), imports of buses, trucks, and other heavy vehicles experienced an increase of 140 percent to $39.5 million. Of this, imports of motor car units increased by 401 percent to $32.1 million compared to the same month last year’s imports of $6.4 million.
Regarding CKD/SKD models, imports of cars, motorcycles, buses, trucks, and other heavy vehicles were down by 27.5 percent to $50.7 million. Of this, motor car imports fell by 25.8 percent to $37.2 million. Motorcycle imports, however, increased by 9.8 percent to $3.6 million, and parts and accessories imports were also down by 4.2 percent to $21.3 million.
https://www.thenews.com.pk/print/1158358-pakistan-sees-double-digit-rise-in-textile-rice-exports-in-janPublished Date: February 17, 2024


